

We have preliminary data that show Robbie Rogers needs to step it up.
Nordecke Luchador will be tracking the Crew's attack this season like no other blog on the planet. To the left is a chart detailing where on the pitch the Crew have produced either a Shot or a Shot on Goal or a Goal. Note that this chart does not reflect free kicks or penalty kicks. We're relying on ESPN's Gamecast feature to track the data, and over the Crew's first three games at least, Gamecast does not show where on the field the free kicks are being taken. Our good friend Colin over at Championship At Best has clued us in on an alternative data source, but we're still working on accessing it. Once we do, we may be able to provide even more insight. And kudos to Colin as well for his outstanding work, upon which we've based the above chart.
How to use the chart? Well, it tells us the Crew is getting good opportunities in the box, which is always a good sign you're team is playing well in the offensive phase. And the attack looks very balanced as well. But the chart is best used in combination with close observation of tactical tendencies in actual games. Is the team looking to push down the wings and cross? Are we trying to break down defenses in front of the goal and get high-percentage shots on give-and-gos and through balls? Should the Crew be taking more shots from the top of the box and beyond? Open beer; drink beer; discuss.
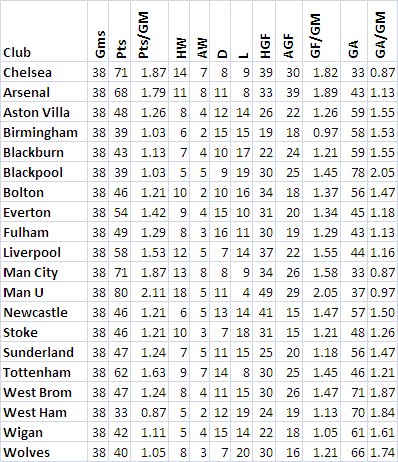
Also, the table below gives us data on the Crew's attack through Saturday's fixture vs the garment clad warriors of RSL.

Notice also that immediately below the Crew's numbers we've included the top offensive players in the MLS this season for comparison. One thing we'd point out right away is that if any one mentions Conor Casey to you as deserving of a roster spot on the USMNT in South Africa, point out to the would-be Einstein that all three of his goals this season are from PKs, same with Cunningham. The talk about Buddle, however, may be warranted.
Finally, once we gain access to the new data stream, which will give us such elusive stats as passes created by a player that could have turned into a G or an Assist or a SHT or a SOG but didn't due to the subsequent player messing up or not quite reaching a beautiful through ball, we're going to tweak the metric. Essentially, we'll be able to add "chances created" to what we already have. This will allow us to include players, especially midfielders like Donovan, who clearly are producing for their clubs but whose production won't always show up as either a G or an A.
Hagalo, Columbus. 'Til I die...


 The Luchametric is a


1 comment:
Outstanding stuff here, especially the first chart. I'm going to need to digest the second for a bit more. I'm glad to see someone else doing some interesting analysis of the available data.
Post a Comment