By El Chupa
After this weekend's games it's become clear who the best and most consistent team in the MLS is at this juncture: our own Black and Gold. As I brush a tear from my eye and gaze in wild wonder at the joy I have found I have only this to say: We're rich Beotch! But seriously, we also now have one to two games in hand compared to our closest rivals. Nice.
Showing posts with label Statistics. Show all posts
Showing posts with label Statistics. Show all posts
Monday, August 24, 2009


Friday, August 21, 2009
EPL Luchametric Ratings Updated
By El Chupacabra
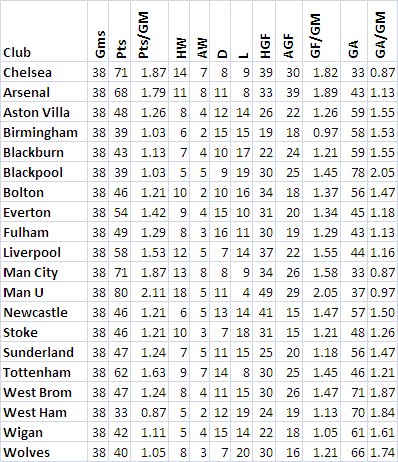
The EPL Luchametric Ratings have been updated in time for this weekend's game. Remember, they are based on scant data and it is very early in the marathon EPL season. El Chupa can tell you this, however: of the big four, Chelsea is playing extremely well, mind-blowingly so. They are swarming all over their opponents on the pitch and in the stats, out shooting them and gaining corners and other chances at a shocking rate. Of the top teams from last season, they are the only one who look like they haven't missed a beat. Remember, this is a team who were bounced out of the UEFA Champions League by Barca by a mere whisker, and most Chelsea fans think game two was stolen from them. El Chupa thinks Barca was and is the better team, but we feel Chelsea's pain.
The EPL Luchametric Ratings have been updated in time for this weekend's game. Remember, they are based on scant data and it is very early in the marathon EPL season. El Chupa can tell you this, however: of the big four, Chelsea is playing extremely well, mind-blowingly so. They are swarming all over their opponents on the pitch and in the stats, out shooting them and gaining corners and other chances at a shocking rate. Of the top teams from last season, they are the only one who look like they haven't missed a beat. Remember, this is a team who were bounced out of the UEFA Champions League by Barca by a mere whisker, and most Chelsea fans think game two was stolen from them. El Chupa thinks Barca was and is the better team, but we feel Chelsea's pain.
Tuesday, July 21, 2009
El Douche-o
By El Chupa
We at El Luchador have decided to weigh in on the Beckham problem. Is he a douche? In our view, yes. Is he good enough for the league to bring him in under special conditions and pay him more than other players in the league who are far more productive? Hardly. Is he worth all the free publicity? Probably. But once a douche, always a douche we says. And we can prove it.
There are a number of issues obviously, from how El Doucho acted on the field and in the locker room with the Galaxy last season, to the MLS' decision to bring him in to help the league in the first place, to the basic question of just how much talent he actually brings to the Galaxy.
Let's take the last question first.
The chart below represents the top 30 offensive players in the MLS in 2008. It includes only those players who scored and who either played a minimum of 1300 minutes or scored a minimum of 5 goals. The Luchametric institute has developed a measure of player production that takes into account goals, assists, shots, shots on goal, the percentage of shots the player puts on goal, and the percentage of SOG the player converts to actual goals. As you can see from the data below, the top scorers not only take more SHT and SOG, they also convert a much higher percentage of their scoring opportunities into actual goals than do average scorers. The Player Production metric thus gives players credit for how many scoring opportunities they create (assists), how many they create and/or are given by their teammates (SHT and SOG), the percentage of SHT they convert to actual SOG or actual quality scoring chances, and the percentage of SOG they convert to actual goals.

Notice that Beckham is ranked 25th, above many scorers and typically above the league averages, but also far below the actual best players in the league such as Donovan, Cooper, Schelotto and others. His number of assists is up at the top, but taken with the other measures it becomes clear that, yes, he's good--but he's not good enough for all of the attention lavished on him by the media. Notice that his Pro/GM is right at the league average, and that his SOG% is below the league average, meaning that when he either creates a shot, or is the recipient of a shot opportunity by one of his teammates, he muffs it more often than does an average scorer in the league. The word for that my friends is Eurotrash.
We at El Luchador have decided to weigh in on the Beckham problem. Is he a douche? In our view, yes. Is he good enough for the league to bring him in under special conditions and pay him more than other players in the league who are far more productive? Hardly. Is he worth all the free publicity? Probably. But once a douche, always a douche we says. And we can prove it.
There are a number of issues obviously, from how El Doucho acted on the field and in the locker room with the Galaxy last season, to the MLS' decision to bring him in to help the league in the first place, to the basic question of just how much talent he actually brings to the Galaxy.
Let's take the last question first.
The chart below represents the top 30 offensive players in the MLS in 2008. It includes only those players who scored and who either played a minimum of 1300 minutes or scored a minimum of 5 goals. The Luchametric institute has developed a measure of player production that takes into account goals, assists, shots, shots on goal, the percentage of shots the player puts on goal, and the percentage of SOG the player converts to actual goals. As you can see from the data below, the top scorers not only take more SHT and SOG, they also convert a much higher percentage of their scoring opportunities into actual goals than do average scorers. The Player Production metric thus gives players credit for how many scoring opportunities they create (assists), how many they create and/or are given by their teammates (SHT and SOG), the percentage of SHT they convert to actual SOG or actual quality scoring chances, and the percentage of SOG they convert to actual goals.
Notice that Beckham is ranked 25th, above many scorers and typically above the league averages, but also far below the actual best players in the league such as Donovan, Cooper, Schelotto and others. His number of assists is up at the top, but taken with the other measures it becomes clear that, yes, he's good--but he's not good enough for all of the attention lavished on him by the media. Notice that his Pro/GM is right at the league average, and that his SOG% is below the league average, meaning that when he either creates a shot, or is the recipient of a shot opportunity by one of his teammates, he muffs it more often than does an average scorer in the league. The word for that my friends is Eurotrash.
Monday, July 20, 2009
El Luchador's Power Rankings
By El Chupa
Starting today, El Luchador is pleased to bring you his personal MLS 2009 Power Rankings. They will be on the right above the standings and will be updated weekly.
The rankings are based on a metric developed by El Luchador's oppressed worker El Chupacabra, in conjunction with the close empirical observation of El Lucha himself. The metric includes a proprietary combination of weighted statistical variables including: goals, wins, losses, draws, shots, shots on goal, shots on goal against, goals against and even corner kicks taken. As well, the metric takes into account goals, wins and draws at home versus goals, wins, and draws away. The raw number gives one a sense of the overall point production of the team across an entire season. The "per game" number gives one a sense of the average power or potential for point production a team brings to each match.
The metric is a work in progress and will be updated as El Chupa and El Lucha continue to wrestle with the murky and alchemical world of soccer statistics. Tune in regularly for updates and analysis, including game predictions and the handicapping of games as a service to those who enjoy responsible wagering on US and world soccer, wherever such wagering is legal.
The metric is designed to provide the fan and wager with a more in-depth understanding of the relative merits of each team. The standings tell us how well each team has fared relative to the others, but the metric, in conjunction with the statistics El Chupa maintains as part of his work at the Luchametric Institute, tell us more about WHY each team has fared as it has. The basic standings only allow us a broad, general grok of the true merits of each team. As we all know, the best team doesn't always win, or even draw. The metric, however, gives us more information, allowing us to draw concrete and quantifiable conclusions about what the points standings DON'T tell us about how good each teams is relative to the other. Look for handicapped previews of this weekend's games later in the week.
Starting today, El Luchador is pleased to bring you his personal MLS 2009 Power Rankings. They will be on the right above the standings and will be updated weekly.
The rankings are based on a metric developed by El Luchador's oppressed worker El Chupacabra, in conjunction with the close empirical observation of El Lucha himself. The metric includes a proprietary combination of weighted statistical variables including: goals, wins, losses, draws, shots, shots on goal, shots on goal against, goals against and even corner kicks taken. As well, the metric takes into account goals, wins and draws at home versus goals, wins, and draws away. The raw number gives one a sense of the overall point production of the team across an entire season. The "per game" number gives one a sense of the average power or potential for point production a team brings to each match.
The metric is a work in progress and will be updated as El Chupa and El Lucha continue to wrestle with the murky and alchemical world of soccer statistics. Tune in regularly for updates and analysis, including game predictions and the handicapping of games as a service to those who enjoy responsible wagering on US and world soccer, wherever such wagering is legal.
The metric is designed to provide the fan and wager with a more in-depth understanding of the relative merits of each team. The standings tell us how well each team has fared relative to the others, but the metric, in conjunction with the statistics El Chupa maintains as part of his work at the Luchametric Institute, tell us more about WHY each team has fared as it has. The basic standings only allow us a broad, general grok of the true merits of each team. As we all know, the best team doesn't always win, or even draw. The metric, however, gives us more information, allowing us to draw concrete and quantifiable conclusions about what the points standings DON'T tell us about how good each teams is relative to the other. Look for handicapped previews of this weekend's games later in the week.
Monday, July 13, 2009
Of Dirty Boots and Hooligans
El Luchador and his comrade, El Chupacabra, continue to pore over MLS statistics at our Advanced Institute for Luchametric Studies. The goal is to develop statistical tools that are soccer-specific which will aid in our understanding and enjoyment of the beautiful game. We also hope to assist those who chose to wager on world futball--in jurisdictions where such activity is legal – to make better-informed bets.
We offer our latest finding because it confirms something many of us have suspected, and because when taken in total with other knowledge and statistics, could form the basis of more productive wagers.Which team in MLS can fairly be given the title of Major League Soccer’s Biggest Bunch of Hacks?
The dirty thugs of Real Salt Lake!As the table below details, Salt Lake has consistently racked up the greatest number of Infraction Points (a measure of both yellow cards and red cards [IP=YC +(2*RC)]) over the last two and half seasons. Chivas is a close second, and as we shall see, a team whose play is perhaps the most troubling.
The table below represents complete data from 2007 and 2008 along with the projected total number of IPs each team will generate by the end of 2009 based on a 30 game season.
| Club | 2007 | 2008 | 2009 Projected | Three Year Total |
| Salt Lake | 169 | 65 | 76 | 310 |
| Chivas USA | 131 | 84 | 79 | 294 |
| Kansas City | 144 | 57 | 77 | 278 |
| Dallas | 146 | 70 | 58 | 274 |
| New York | 98 | 76 | 68 | 242 |
| Chicago | 110 | 69 | 62 | 241 |
| D.C. | 103 | 78 | 60 | 241 |
| Toronto | 130 | 62 | 47 | 239 |
| Colorado | 112 | 54 | 58 | 224 |
| Columbus | 79 | 67 | 66 | 212 |
| Los Angeles | 72 | 59 | 68 | 199 |
| New England | 76 | 64 | 58 | 198 |
| Houston | 83 | 63 | 52 | 198 |
| San Jose | 0 | 64 | 73 | 137 |
Note the big drop off in the total number of cards issued in the league in 2008 as compared to 2007. One wonders what happened. Better officiating? Better players? More ladies on the team buses before and after games? Who knows? An in-depth analysis is forthcoming.
Do Reds and Yellows lead to more goals against or to fewer points in the standings? In other words, do the teams who commit the greatest number of heinous fouls suffer as a result? A preliminary analysis suggests that on average, hacks are a weak indicator of a team's overall place in the standings, and that dirty play doesn''t necessarily add up to losses.

The chart above shows that as hacks went up, teams were on both sides of the league average in terms of number of PTS generated. In short, there is no direct correlation indicating that if you foul more than the other team, your chances of winning go down. In some cases yes, in some no.
The data from 2007 is a bit stranger. Again the average number of PTS was 41 but the average number of IPs was 112. Notice that three of the four teams with the greatest number of PTS had fewer IPs than the league average, but one of those teams (again, the hooligans of Chivas) had 131 IPs, or a substantially higher number of IPs than the league average. This again suggests that dirty play doesn't necessarily result in enough cards and free kicks to hurt a team in the long run. Should you foul in the Penalty Area? Of course not. We're talking about general trends across an entire season.

The bottom line: they may make the beautiful game ugly, but as long as teams like Chivas can play dirty and still earn PTS, they have little incentive to alter their style of play. So hack away you dirty thugs! But remember the wisdom of Kahn: revenge is a dish best served cold.
Subscribe to:
Posts (Atom)



 The Luchametric is a



 Posts
Posts